Manifold learning: non-linear dimension reduction
Sources:
Nonlinear dimensionality reduction or manifold learning cover unsupervised methods that attempt to identify low-dimensional manifolds within the original \(P\)-dimensional space that represent high data density. Then those methods provide a mapping from the high-dimensional space to the low-dimensional embedding.
Multi-dimensional Scaling (MDS)
Resources:
http://www.stat.pitt.edu/sungkyu/course/2221Fall13/lec8_mds_combined.pdf
Hastie, Tibshirani and Friedman (2009). The Elements of Statistical Learning: Data Mining, Inference, and Prediction. New York: Springer, Second Edition.
The purpose of MDS is to find a low-dimensional projection of the data in which the pairwise distances between data points is preserved, as closely as possible (in a least-squares sense).
Let \(\mathbf{D}\) be the \((N \times N)\) pairwise distance matrix where \(d_{ij}\) is a distance between points \(i\) and \(j\).
The MDS concept can be extended to a wide variety of data types specified in terms of a similarity matrix.
Given the dissimilarity (distance) matrix \(\mathbf{D}_{N \times N}=[d_{ij}]\), MDS attempts to find \(K\)-dimensional projections of the \(N\) points \(\mathbf{x}_1, \ldots, \mathbf{x}_N \in \mathbb{R}^K\), concatenated in an \(\mathbf{X}_{N \times K}\) matrix, so that \(d_{ij} \approx \|\mathbf{x}_i - \mathbf{x}_j\|\) are as close as possible. This can be obtained by the minimization of a loss function called the stress function
This loss function is known as least-squares or Kruskal-Shepard scaling.
A modification of least-squares scaling is the Sammon mapping
The Sammon mapping performs better at preserving small distances compared to the least-squares scaling.
Classical multidimensional scaling
Also known as principal coordinates analysis, PCoA.
The distance matrix, \(\mathbf{D}\), is transformed to a similarity matrix, \(\mathbf{B}\), often using centered inner products.
The loss function becomes
The stress function in classical MDS is sometimes called strain.
The solution for the classical MDS problems can be found from the eigenvectors of the similarity matrix.
If the distances in \(\mathbf{D}\) are Euclidean and double centered inner products are used, the results are equivalent to PCA.
Example
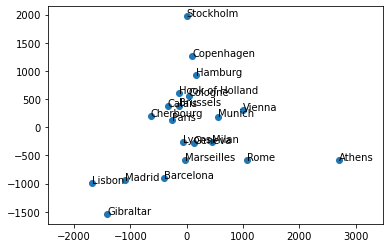
The eurodist datset provides the road distances (in kilometers)
between 21 cities in Europe. Given this matrix of pairwise
(non-Euclidean) distances \(\mathbf{D}=[d_{ij}]\), MDS can be used
to recover the coordinates of the cities in some Euclidean referential
whose orientation is arbitrary.
import pandas as pd
import numpy as np
import matplotlib.pyplot as plt

# Pairwise distance between European cities
try:
    url = '../datasets/eurodist.csv'
    df = pd.read_csv(url)
except:
    url = 'https://github.com/duchesnay/pystatsml/raw/master/datasets/eurodist.csv'
    df = pd.read_csv(url)

print(df.iloc[:5, :5])

city = df["city"]
D = np.array(df.iloc[:, 1:])  # Distance matrix

# Arbitrary choice of K=2 components
from sklearn.manifold import MDS
mds = MDS(dissimilarity='precomputed', n_components=2, random_state=40, max_iter=3000, eps=1e-9)
X = mds.fit_transform(D)
        city  Athens  Barcelona  Brussels  Calais
0     Athens       0       3313      2963    3175
1  Barcelona    3313          0      1318    1326
2   Brussels    2963       1318         0     204
3     Calais    3175       1326       204       0
4  Cherbourg    3339       1294       583     460
Recover coordinates of the cities in Euclidean referential whose orientation is arbitrary:
from sklearn import metrics
Deuclidean = metrics.pairwise.pairwise_distances(X, metric='euclidean')
print(np.round(Deuclidean[:5, :5]))
[[   0. 3116. 2994. 3181. 3428.]
 [3116.    0. 1317. 1289. 1128.]
 [2994. 1317.    0.  198.  538.]
 [3181. 1289.  198.    0.  358.]
 [3428. 1128.  538.  358.    0.]]
Plot the results:
# Plot: apply some rotation and flip
theta = 80 * np.pi / 180.
rot = np.array([[np.cos(theta), -np.sin(theta)],
                [np.sin(theta),  np.cos(theta)]])
Xr = np.dot(X, rot)
# flip x
Xr[:, 0] *= -1
plt.scatter(Xr[:, 0], Xr[:, 1])

for i in range(len(city)):
    plt.text(Xr[i, 0], Xr[i, 1], city[i])
plt.axis('equal')
(-1894.0919178069155,
 2914.3554370871234,
 -1712.9733697197494,
 2145.437068788015)
Determining the number of components
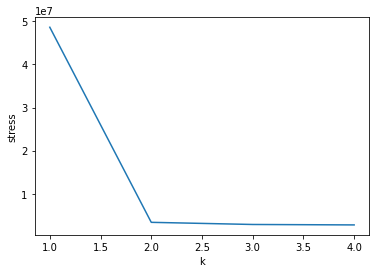
We must choose \(K^* \in \{1, \ldots, K\}\) the number of required components. Plotting the values of the stress function, obtained using \(k \leq N-1\) components. In general, start with \(1, \ldots K \leq 4\). Choose \(K^*\) where you can clearly distinguish an elbow in the stress curve.
Thus, in the plot below, we choose to retain information accounted for by the first two components, since this is where the elbow is in the stress curve.
k_range = range(1, min(5, D.shape[0]-1))
stress = [MDS(dissimilarity='precomputed', n_components=k,
           random_state=42, max_iter=300, eps=1e-9).fit(D).stress_ for k in k_range]

print(stress)
plt.plot(k_range, stress)
plt.xlabel("k")
plt.ylabel("stress")
[48644495.28571428, 3356497.365752386, 2858455.495887962, 2756310.637628011]
Text(0, 0.5, 'stress')
Exercises
Apply MDS from sklearn on the iris dataset available at:
https://github.com/duchesnay/pystatsml/raw/master/datasets/iris.csv
Center and scale the dataset.
Compute Euclidean pairwise distances matrix.
Select the number of components.
Show that classical MDS on Euclidean pairwise distances matrix is equivalent to PCA.
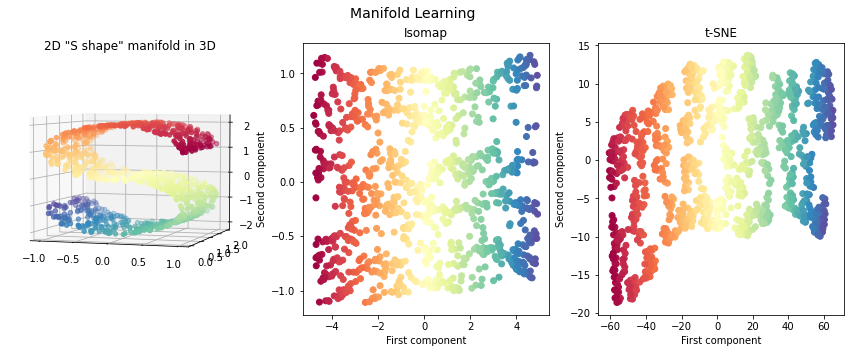
Manifold learning
Dataset S curve:
import matplotlib.pyplot as plt
from mpl_toolkits.mplot3d import Axes3D
from sklearn import manifold, datasets

X, color = datasets.make_s_curve(1000, random_state=42)
Isomap
Isomap is a nonlinear dimensionality reduction method that combines a procedure to compute the distance matrix with MDS. The distances calculation is based on geodesic distances evaluated on neighborhood graph:
Determine the neighbors of each point. All points in some fixed radius or K nearest neighbors.
Construct a neighborhood graph. Each point is connected to other if it is a K nearest neighbor. Edge length equal to Euclidean distance.
Compute shortest path between pairwise of points \(d_{ij}\) to build the distance matrix \(\mathbf{D}\).
Apply MDS on \(\mathbf{D}\).
isomap = manifold.Isomap(n_neighbors=10, n_components=2)
X_isomap = isomap.fit_transform(X)
t-SNE
Sources:
Principles
Construct a (Gaussian) probability distribution between pairs of object in input (high-dimensional) space.
Construct a (student) ) probability distribution between pairs of object in embeded (low-dimensional) space.
Minimize the Kullback–Leibler divergence (KL divergence) between the two distributions.
Features
Isomap, LLE and variants are best suited to unfold a single continuous low dimensional manifold
t-SNE will focus on the local structure of the data and will tend to extract clustered local groups of samples
tsne = manifold.TSNE(n_components=2, init='pca', random_state=0)
X_tsne = tsne.fit_transform(X)
fig = plt.figure(figsize=(15, 5))
plt.suptitle("Manifold Learning", fontsize=14)

ax = fig.add_subplot(131, projection='3d')
ax.scatter(X[:, 0], X[:, 1], X[:, 2], c=color, cmap=plt.cm.Spectral)
ax.view_init(4, -72)
plt.title('2D "S shape" manifold in 3D')

ax = fig.add_subplot(132)
plt.scatter(X_isomap[:, 0], X_isomap[:, 1], c=color, cmap=plt.cm.Spectral)
plt.title("Isomap")
plt.xlabel("First component")
plt.ylabel("Second component")

ax = fig.add_subplot(133)
plt.scatter(X_tsne[:, 0], X_tsne[:, 1], c=color, cmap=plt.cm.Spectral)
plt.title("t-SNE")
plt.xlabel("First component")
plt.ylabel("Second component")
plt.axis('tight')
(-67.00072708129883, 71.46007766723633, -20.22462863922119, 15.324001502990722)
Exercises
Run Manifold learning on handwritten digits: Locally Linear Embedding, Isomap with scikit-learn